
Plot live data with ControlCommand scripts: multi-series charts, many chart types, legend toggle, add/remove series, export graph data to CSV
How to add the Graphy robot skill
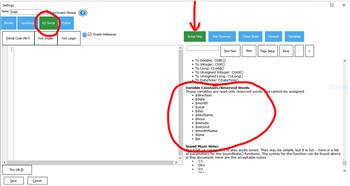
- Load the most recent release of ARC (Get ARC).
- Press the Project tab from the top menu bar in ARC.
- Press Add Robot Skill from the button ribbon bar in ARC.
- Choose the Graphs category tab.
- Press the Graphy icon to add the robot skill to your project.
Don't have a robot yet?
Follow the Getting Started Guide to build a robot and use the Graphy robot skill.
How to use the Graphy robot skill
The Graphy skill is used for creating graphs and plotting data using ControlCommand() scripts. Graph data can be saved as a .CSV file.
Main Window
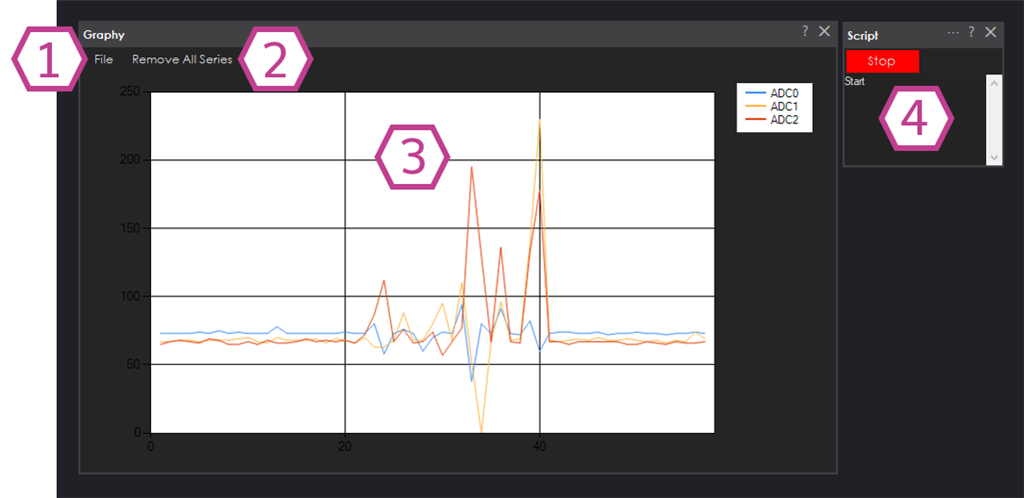
1. File Button Save the Graph data to a .CSV file
2. Remove All Series Button Clears all the graph data.
3. Graph Window Displays all the graph data.
4. Script In order to use the Graphy skill a Script must be used to populate graph data.
How to Use the Graphy Skill
Add Data
ControlCommand("Graphy", AddData, SeriesName, YData)

Example: ControlCommand("Graphy", AddData, "Test Data", $value)
Adds data to the series name. If the series name doesn't exist, a series will be created with the specified name.
Add New Series
ControlCommand("Graphy", AddSeries, SeriesName, type)

Example: ControlCommand("Graphy", AddSeries, "Test Data", "line")
Adds a series to the chart with the specified name. The series chart type must be one of: Point, FastPoint, Bubble, Line, Spline, StepLine, FastLine, Bar, StackedBar, StackedBar100, Column, StackedColumn, StackedColumn100, Area, SplineArea, StackedArea, StackedArea100, Pie, Doughnut, Stock, Candlestick, Range, SplineRange, RangeBar, RangeColumn, Radar, Polar, ErrorBar, BoxPlot, Renko, ThreeLineBreak, Kagi, PointAndFigure, Funnel, Pyramid. Some types may return an error because they require only 1 series in the chart.
Change Series Type
ControlCommand("Graphy", ChangeSeriesType, SeriesName, type)

Example: ControlCommand("Graphy", ChangeSeriesType, "Test Data", "line")
Changes the series type of the chart with the specified name. The series chart type must be one of: Point, FastPoint, Bubble, Line, Spline, StepLine, FastLine, Bar, StackedBar, StackedBar100, Column, StackedColumn, StackedColumn100, Area, SplineArea, StackedArea, StackedArea100, Pie, Doughnut, Stock, Candlestick, Range, SplineRange, RangeBar, RangeColumn, Radar, Polar, ErrorBar, BoxPlot, Renko, ThreeLineBreak, Kagi, PointAndFigure, Funnel, Pyramid. Some types may return an error because they require only 1 series in the chart.
Reset All Chart Data
ControlCommand("Graphy", RemoveAllSeries)

Example: ControlCommand("Graphy", RemoveAllSeries)
Resets all the chart data for all series.
Remove Series Data
ControlCommand("Graphy", RemoveSeries, SeriesName)

Example: ControlCommand("Graphy", RemoveSeries, "Test Data")
Resets all the chart data for the specified series only.
Show Legend
ControlCommand("Graphy", ShowLegend, true/false)

Example: ControlCommand("Graphy", ShowLegend, true/false)
Enables/disables the legend. Use this if you require more screen real-estate by removing the legend.
Code Sample
This code will graph 3 servo positions while the servos are moving.ControlCommand("Graphy", RemoveAllSeries)
:loop
$pos = getservo(d0)
ControlCommand("Graphy", AddData, "Servo D0", $pos)
$pos = getservo(d1)
ControlCommand("Graphy", AddData, "Servo D1", $pos)
$pos = getservo(d4)
ControlCommand("Graphy", AddData, "Servo D4", $pos)
sleep(250)
goto(loop)