Map
Utility.map(input, inputMin, inputMax, outputMin, outputMax)
Parameters
| input | Value to map. |
| inputMin | Minimum value the input can be. |
| inputMax | Maximum value the input can be. |
| outputMin | Minimum value the output can be. |
| outputMax | Maximum value the output can be. |
Returns
input mapped onto the provided range of outputs.Description
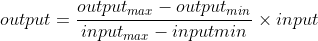
Maps input onto the provided range of outputs. (e.g. if input is halfway between inputMin and inputMax, then this function will return the value halfway between ouputMin and outputMax).
The formula for calculating the return value is shown below.