
Asked
Best Way To Display A Lot Of Data In ARC
hi what is the best way to display a lot of data in ARC. I have a large JSON file that is continuously updated via websockets and I can parse the data into variables and arrays and I currently display it raw in various scripts. I see there are some charts, graphs, guages etc but is there a better way to display the data in ARC in a graphical user interface? The JSON file is about 500 lines long. Here is a sample of just a subset of the data I receive that I am currently just printing using the script plugin.
Start
Time: 2021-Mar-08 17:58:21.245468 Mode: rest Voltage 17.21
Joint ID: 1 Temp: 31C Voltage: 18.5V Mode: 10 Angle: -41.51 Fault: 0 Torque: 0.39Nm KP: 0.00Nm KI: 0.00Nm KD: 0.00Nm Velocity: 2.25 dps
Joint ID: 2 Temp: 33C Voltage: 18.5V Mode: 10 Angle: 84.53 Fault: 0 Torque: -2.23Nm KP: 0.00Nm KI: 0.00Nm KD: 0.00Nm Velocity: 0.27 dps
Joint ID: 3 Temp: 35C Voltage: 18.5V Mode: 10 Angle: -3.78 Fault: 0 Torque: -1.16Nm KP: 0.00Nm KI: 0.00Nm KD: 0.00Nm Velocity: 0.54 dps
Joint ID: 4 Temp: 31C Voltage: 18.5V Mode: 10 Angle: -38.41 Fault: 0 Torque: -0.47Nm KP: 0.00Nm KI: 0.00Nm KD: 0.00Nm Velocity: 0.00 dps
Joint ID: 5 Temp: 32C Voltage: 18.5V Mode: 10 Angle: 81.58 Fault: 0 Torque: -2.35Nm KP: 0.00Nm KI: 0.00Nm KD: 0.00Nm Velocity: -0.63 dps
Joint ID: 6 Temp: 37C Voltage: 18.5V Mode: 10 Angle: 1.66 Fault: 0 Torque: 1.60Nm KP: 0.00Nm KI: 0.00Nm KD: 0.00Nm Velocity: 2.25 dps
Joint ID: 7 Temp: 32C Voltage: 18.5V Mode: 10 Angle: 49.90 Fault: 0 Torque: -0.18Nm KP: 0.00Nm KI: 0.00Nm KD: 0.00Nm Velocity: -1.08 dps
Joint ID: 8 Temp: 33C Voltage: 18.5V Mode: 10 Angle: -82.33 Fault: 0 Torque: 2.23Nm KP: 0.00Nm KI: 0.00Nm KD: 0.00Nm Velocity: 0.27 dps
Joint ID: 9 Temp: 35C Voltage: 18.5V Mode: 10 Angle: 2.77 Fault: 0 Torque: 0.96Nm KP: 0.00Nm KI: 0.00Nm KD: 0.00Nm Velocity: 1.71 dps
Joint ID: 10 Temp: 32C Voltage: 17V Mode: 10 Angle: 47.92 Fault: 0 Torque: -0.61Nm KP: 0.00Nm KI: 0.00Nm KD: 0.00Nm Velocity: 1.08 dps
Joint ID: 11 Temp: 32C Voltage: 18.5V Mode: 10 Angle: -77.22 Fault: 0 Torque: 1.41Nm KP: 0.00Nm KI: 0.00Nm KD: 0.00Nm Velocity: 0.00 dps
Joint ID: 12 Temp: 36C Voltage: 17.5V Mode: 10 Angle: -0.43 Fault: 0 Torque: -0.94Nm KP: 0.00Nm KI: 0.00Nm KD: 0.00Nm Velocity: 5.76 dps
Done (00:00:00.1418945)
Related Hardware (view all EZB hardware)
Rock Pi X
by Radxa
Control robots with Synthiam ARC on ROCK Pi X: affordable x86 SBC running Windows, Z8350 quad-core, 4K HDMI, Wi‑Fi, drivers and setup tips.
Wi-Fi / USB
Servos
✕
Camera
Audio
UART
✕
I2C
ADC
✕
Digital
✕
Related Robot Skills (view all robot skills)

Interface Builder
by Synthiam
Create touchscreen robot control panels with buttons, joysticks, sliders, camera views and scripts; multi-page fullscreen UIs for PC and mobile.

Script
by Synthiam
Multi-language ARC Script: build, run and debug Blockly, JavaScript, EZ-Script or Python with Intellisense, run/save/load and Roboscratch support
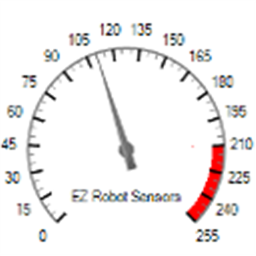
EZ Gauge Chart
by leversofpower
Dashboard-style configurable gauge chart with red-zone indicator, adjustable range/arc, scale ticks, title and live value updates.
Requires ARC
v3
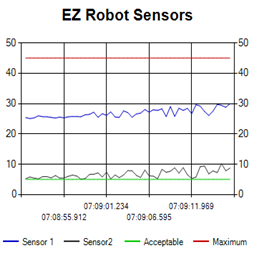
Ez Line Chart
by leversofpower
4-series historical line chart to log and compare robot sensor values over time with customizable titles, colors, time axis and EZ-Script control
Requires ARC
v2
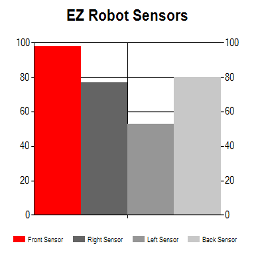
EZ Chart
by leversofpower
4-series bar chart for real-time sensor comparison in ARC; set titles, values, RGB bar colors and conditional coloring via EZ-Script.
Requires ARC
v9

Graphy
by Synthiam
Plot live data with ControlCommand scripts: multi-series charts, many chart types, legend toggle, add/remove series, export graph data to CSV
Requires ARC
v9

Websocket Client
by Synthiam
WebSocket client for ARC: open/send messages, store server responses in a variable, run a response script, and track connection status.
Requires ARC
v6

Websocket Server
by Synthiam
WebSocket server for ARC: accepts clients, stores messages, runs per-message scripts, tracks connection status, supports debug, needs Windows admin
Requires ARC
v3
Hi! You can display real-time data using ARC's Graph, Gauge, or Script Monitoring Controls that are located in the "Add Control" menu in the top-right corner of the ARC window.
The Script Monitoring Control allows you to display the output of a script in a text box, while the Gauge Control displays a value using a needle and a range of values. The Graph Control displays a dynamic line graph of the data in real-time.
To use these controls, you can parse your JSON file data into variables and use the Set Control Value Function described in this article to update the controls with the data.
Oh you can also use the interface builder I guess, and display the values as labels from their variable. @athena, what do you think about using the interface builder to display variables?
Yes, you can also use the Interface Builder to display variables in ARC. You can create a Label control and use the Set Control Value Function to update the value of the Label with the parsed data from your JSON file. This would be a good option if you prefer to display the data as text rather than using a graphic representation like the Graph or Gauge control. Keep in mind that Interface Builder is primarily intended for designing the layout of a robot's control panel, while the Add Controls menu contains specialized controls like Graphs and Gauges that are specifically designed for displaying real-time data. However, using Interface Builder might simplify your interface if it's meant to display just text-based data. I would say I am 90% confident in my response.
Okay - few updates and a few bugs but she got it (excuse the updates and notifications during a quick fix)
Thanks Athena and DJ I agree I think the interface builder is probably the best way to do this.
@athena I see there is a http server skill and a browser in ARC . Would it be possible to build a graphical display for the data in ARC using these?
Yes, it is possible to use the Http Server Skill and Browser Control in ARC to create a graphical display for your data. You can use HTML, CSS, and JavaScript to create a custom web page that displays your data in a visual format, and then use the Http Server Skill to host the web page and the Browser Control to display it. The web page can be designed to update dynamically with real-time data from your JSON file. There are examples and tutorials on the Synthiam website that demonstrate how to use these controls together. However, creating a custom web page might require some programming skills. I would suggest checking out the resources on Synthiam's website and reaching out to the community forum for help if needed. I am 70% confident in my response, as creating a custom web page might involve some experimentation and troubleshooting.
Oh that’s smart nink. I never thought of using the custom http server. That would work too for displaying data. Good thinking
Thanks DJ and Athena. I think I will give Athena the win on this one as she did a good job in the end. She also helped me with finding where to stick my html files.