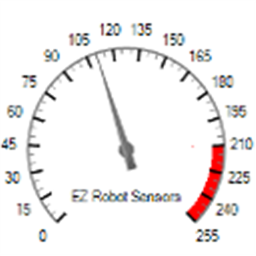
Dashboard-style configurable gauge chart with red-zone indicator, adjustable range/arc, scale ticks, title and live value updates.
Requires ARC
v3
(Updated 11/12/2015)
Compatible with:
 Windows
How to add the EZ Gauge Chart robot skill
- Load the most recent release of ARC (Get ARC).
- Press the Project tab from the top menu bar in ARC.
- Press Add Robot Skill from the button ribbon bar in ARC.
- Choose the Graphs category tab.
- Press the EZ Gauge Chart icon to add the robot skill to your project.
Don't have a robot yet?
Follow the Getting Started Guide to build a robot and use the EZ Gauge Chart robot skill.
How to use the EZ Gauge Chart robot skill
Dashboard style gauge chart with red zone display. v0.0 initial release.
This plugin is the most complex of leversofpower's chart plugins. Enjoy.
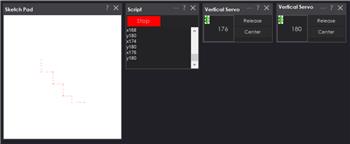
Red Zone Chart (EZ-Script example)
#Red Zone Chart
ControlCommand("EZ Gauge Chart", "SetRangeMaximum", 255)
ControlCommand("EZ Gauge Chart", "SetRangeMinimum", 0)

ControlCommand("EZ Gauge Chart", "ScaleLinesMajorStep", 15)
ControlCommand("EZ Gauge Chart", "ScaleLineMinorCount", 2)

ControlCommand("EZ Gauge Chart", "SetRangeArcStart", 135)
ControlCommand("EZ Gauge Chart", "SetRangeArcSweep", 270)

ControlCommand("EZ Gauge Chart", "SetTitle", "EZ Robot Sensors")
ControlCommand("EZ Gauge Chart", "SetTitlePosition", 80, 150)

ControlCommand("EZ Gauge Chart", "SetRedZoneVisible", "y")
ControlCommand("EZ Gauge Chart", "SetRedZoneRange", 210, 255)

$RandomGaugeValue = 0
:loop
$RandomGaugeValue = GetRandom(105, 150)
ControlCommand("EZ Gauge Chart", "SetValue", $RandomGaugeValue)
Sleep( 10 )
Goto (loop)
360 Circle Gauge (EZ-Script example)
#360 Gauge Chart
ControlCommand("EZ Gauge Chart", "SetRangeMinimum", 0)
ControlCommand("EZ Gauge Chart", "SetRangeMaximum", 360)

ControlCommand("EZ Gauge Chart", "ScaleLinesMajorStep", 20)
ControlCommand("EZ Gauge Chart", "ScaleLineMinorCount", 3)

ControlCommand("EZ Gauge Chart", "SetRangeArcStart", 270)
ControlCommand("EZ Gauge Chart", "SetRangeArcSweep", 360)

ControlCommand("EZ Gauge Chart", "SetTitle", "DIRECTIONAL HEADING")
ControlCommand("EZ Gauge Chart", "SetTitlePosition", 55, 0)

$RandomGaugeValue = 0
:loop
$RandomGaugeValue = GetRandom(0, 360)
ControlCommand("EZ Gauge Chart", "SetValue", $RandomGaugeValue)
Sleep( 10 )
Goto (loop)
1024 Gauge Chart (EZ-Script example)
ControlCommand("EZ Gauge Chart", "SetRangeMinimum", 0)
ControlCommand("EZ Gauge Chart", "SetRangeMaximum", 1024)

ControlCommand("EZ Gauge Chart", "ScaleLinesMajorStep", 64)
ControlCommand("EZ Gauge Chart", "ScaleLineMinorCount", 3)

ControlCommand("EZ Gauge Chart", "SetRangeArcStart", 135)
ControlCommand("EZ Gauge Chart", "SetRangeArcSweep", 270)

ControlCommand("EZ Gauge Chart", "SetTitle", "ANALOG 1 SENSOR VALUE")
ControlCommand("EZ Gauge Chart", "SetTitlePosition", 53, 200)

$RandomGaugeValue = 0
:loop
$RandomGaugeValue = GetRandom(0, 200)
ControlCommand("EZ Gauge Chart", "SetValue", $RandomGaugeValue)
Sleep( 10 )
Goto (loop)