

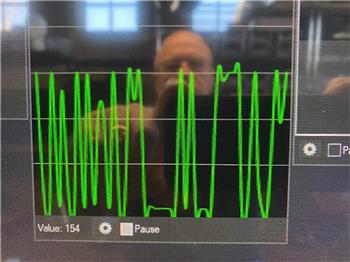
Historical ADC graph and numeric readout (0-255) for 0-3.3/5V inputs; configurable board/port, sample interval, color, and pause for ezb controllers.
How to add the ADC Graph robot skill
- Load the most recent release of ARC (Get ARC).
- Press the Project tab from the top menu bar in ARC.
- Press Add Robot Skill from the button ribbon bar in ARC.
- Choose the ADC category tab.
- Press the ADC Graph icon to add the robot skill to your project.
Don't have a robot yet?
Follow the Getting Started Guide to build a robot and use the ADC Graph robot skill.
How to use the ADC Graph robot skill
The ADC Graph robot skill displays an EZ-B analog input (ADC) as a live scrolling historical graph. This is useful for viewing how an analog sensor changes over time (for example: potentiometers, light sensors, flex sensors, pressure sensors, analog distance sensors, etc.).
ADC stands for Analog-to-Digital Converter. EZ-B analog ports can read a changing voltage and convert it into a number that ARC can use. The EZ-B ADC range is from 0 volts up to the board’s TTL High voltage (typically 3.3V or 5V, depending on your controller configuration).
ARC represents the ADC input as a value from 0 to 255:
- 0 = 0V
- 255 = TTL High (3.3V or 5V)
- Values between are a linear representation of the measured voltage.
Main Window
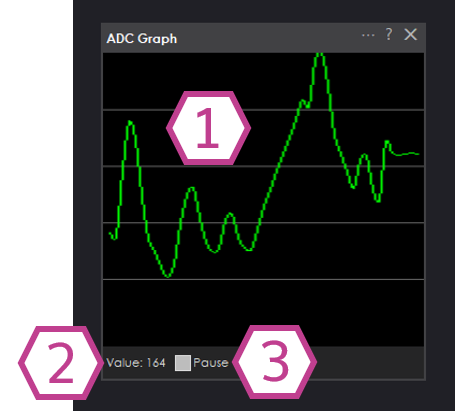
1. Graph Display
Displays the ADC value over time in a line graph. New samples are plotted continuously using the sampling interval
configured in the settings.
2. Value Display
Displays the current ADC numeric value detected (0 - 255). This number corresponds to the measured voltage between
0V and your TTL High voltage (3.3V or 5V).
3. Pause Checkbox
When checked, ADC sampling and graph updates are paused. Uncheck to resume live readings.
Settings
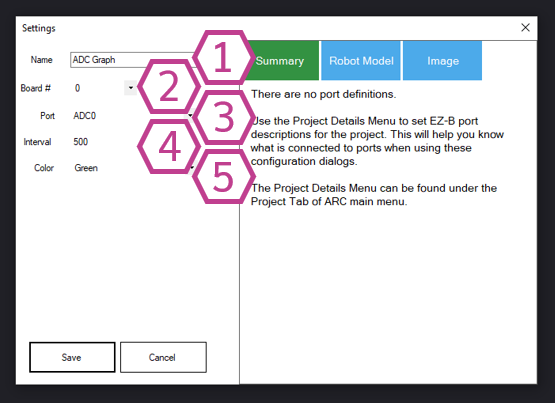
1. Title Field
The title of this skill as it appears in your ARC project. You may change it to anything you like.
Note: Changing the title also changes the name used by controlCommand() for this skill.
2. Board Drop-down
Select the EZ-B board number (connection index) that contains the ADC port you want to read. This is useful when using
multiple EZ-B controllers in one ARC project.
3. Port Drop-down
Select the ADC port to read from. This must be an analog-capable port on your I/O controller.
4. Interval Drop-down
Select the delay (in milliseconds) between ADC samples. Smaller values update the graph more frequently, but can increase
CPU usage and communication traffic. Larger values update less often, which can be helpful for slow-changing sensors.
5. Color Drop-down
Select the color used for the graph line to make it easier to read or to match your project theme.
How to Use ADC Graph
- Add the ADC Graph skill to your ARC project: Project → Add Skill → ADC → ADC Graph.
- Open the skill Settings and select the correct Board and ADC Port that your analog device is connected to.
- Choose an Interval to control how often readings are taken.
- View the live value and historical trend in the Main Window. Use Pause to freeze the display for inspection.
ADC ports measure voltage. Make sure your sensor output voltage stays within the safe range: 0V to TTL High (3.3V or 5V). Exceeding this range can produce incorrect readings and may damage your controller.
Video
Requirements
Related Tutorials
Flex Sensor With An ADC Port Tutorial
Using ADC (Analog To Digital) Ports, Commands And Controls.
Related Questions
Upgrade to ARC Pro
ARC Pro is your passport to a world of endless possibilities in robot programming, waiting for you to explore.