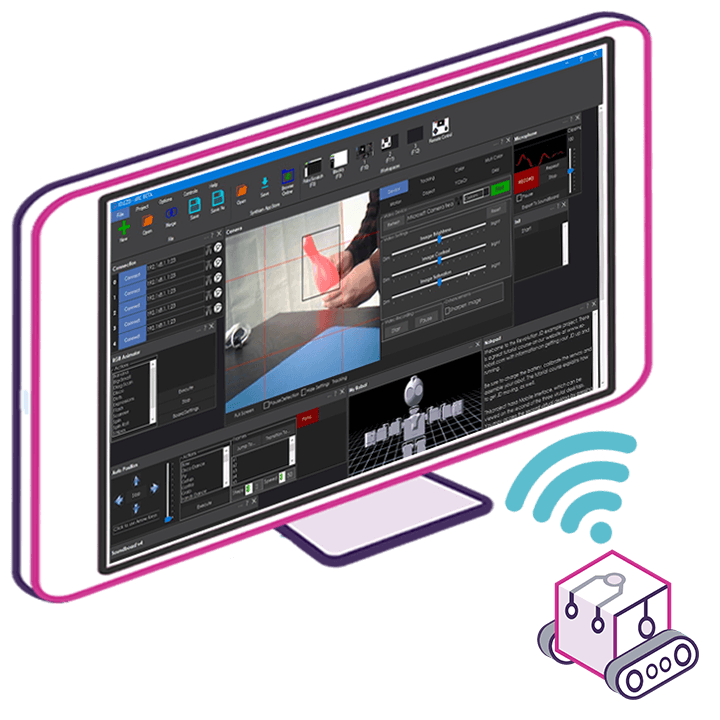
i have a hardware design ,but since i dont know much about SDK or programming ,i need to know what is needed,i have API codes and each does and info it puts out
Also have working examples in python and linux if that can help ,plus more hacking info
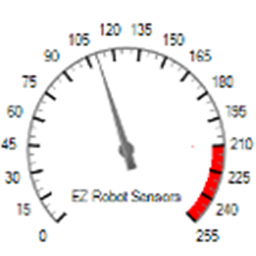 EZ Gauge Chart
— Dashboard-style configurable gauge chart with red-zone indicator, adjustable range/arc, scale ticks, title and live value updates.
Try it →
i have a hardware design ,but since i dont know much about SDK or programming ,i need to know what is needed,i have API codes and each does and info it puts out
Also have working examples in python and linux if that can help ,plus more hacking info