Asked
— Edited

Funny Talking Leds&Servo
amazing what you can do with 3 items.
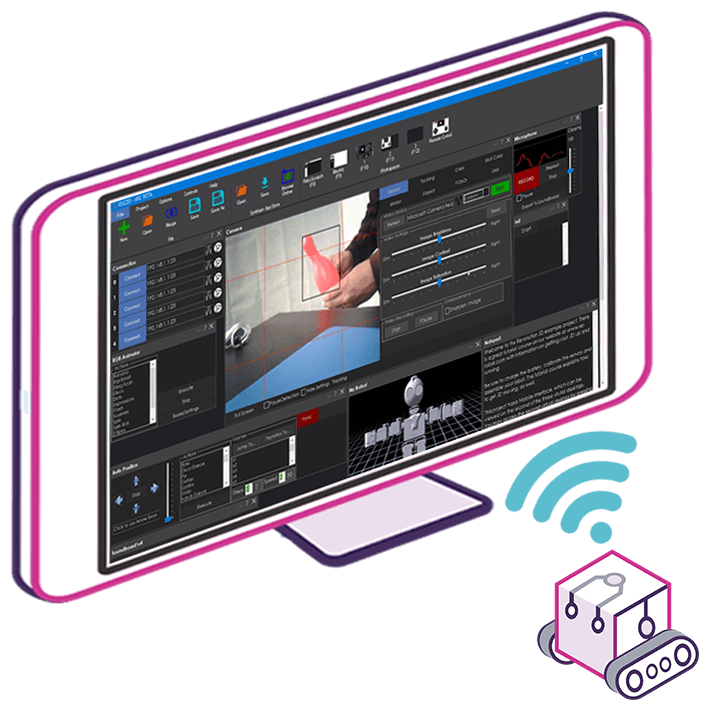
 Camera Overlay
— Displays trained object names as overlays on the Camera Device video stream using Camera Device's object-tracking (shows $CameraObjectName).
Try it →
Camera Overlay
— Displays trained object names as overlays on the Camera Device video stream using Camera Device's object-tracking (shows $CameraObjectName).
Try it →
@Nomad, that's very clever! You should share your projects like this on the EZ-Cloud publicly so others can learn from your projects and see how you scripted them.
hi justin its good for practise.
haha that's cute. nice work Nomad!
dj
thanks
justin i will make it public .
here it is.using 3 items 2 led and a servo .there are extra empty windows in for, making your own scripts.
testbase for scripting
Nice work Patrick! You better keep an eye on those LED's and servos so they don't get too smart.
Very neat Nomad!
Sebediah&holy1
thanks its a lot off fun.