
Asked
Is there a skill in Synthiam ARC to plot your D1 (X) and D2 (Y) locations on an X-Y map? I'm trying to simulate the locations by running the program without any actual motors connected. Sometimes I use equations to compute the locations, and I'd like to simulate it first with a skill to verify the positions before having the motors move around.
Related Hardware (view all EZB hardware)
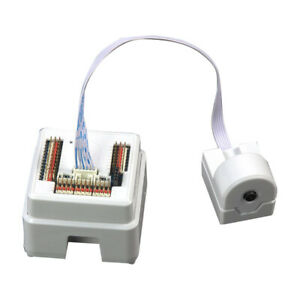
EZ-B V4
by EZ-Robot
EZ-B v4/2 robot controller: dual Cortex ARM, Wi-Fi, audio/video, 24 servo/digital ports, I2C/UART, camera and Synthiam ARC control for custom robots
Wi-Fi / USB
Servos
24
Camera
Audio
UART
3
I2C
ADC
8
Digital
24
Related Robot Skills (view all robot skills)

Placeholder
by thomasfromla

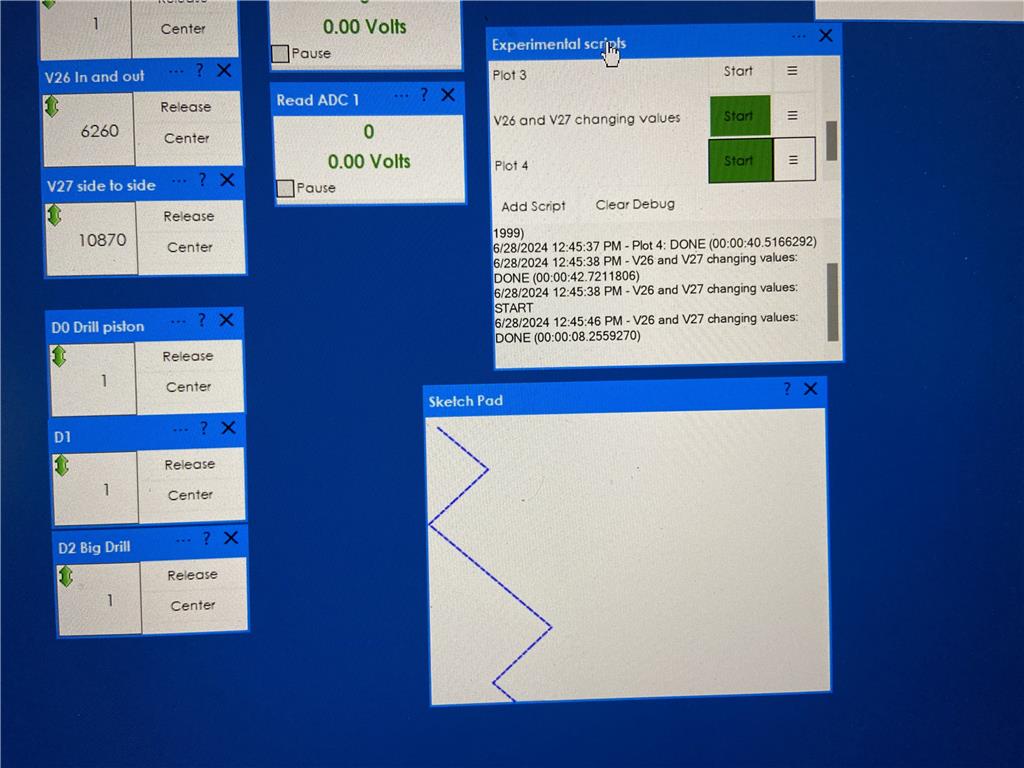
Sketch Pad
by Synthiam
Script-driven Sketch Pad for ARC: draw shapes, text, lines and faces via controlCommand() to visualize object locations, paths and robot data.
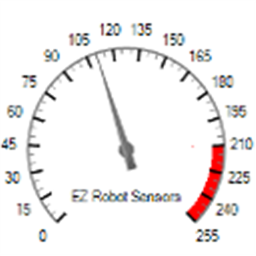
EZ Gauge Chart
by leversofpower
Dashboard-style configurable gauge chart with red-zone indicator, adjustable range/arc, scale ticks, title and live value updates.
Requires ARC
v3

You are correct-there is some issue throwing it off. That is why I'm taking the time to explain that the only way to identify what is "throwing it off" is by debugging.
We added PRINT statements to help debug, but you are still not referencing the output. The idea of printing out the values is so that you can understand what is going on. Again, it is impossible for anyone not in front of your computer to debug what is happening. Only you can figure that out because you're the only human in front of your computer. So, you will have to look at the screen and see the debug values being printed. You can identify what the issue is.
Also, you can't close ARC because the popup message needs to be pressed OK. You have to move the mouse cursor onto the " OK " button in the popup error. But the thing is, the sketch pad robot skill is ancient, so it behaves quite a bit differently than anything newer. Those are going to be the unusual things to experience. But the main thing we're helping you do is debug to find out what is happening.
Not sure if you copied the correct script because there was an edit at some point. So use this one and make sure it works.
It sounds like you're encountering an issue with the script, and it's causing ARC to become unresponsive. Let's break down the steps to debug and resolve this issue.
Debugging Steps
Check for Syntax Errors: Ensure that the script is correctly formatted and that there are no syntax errors. JavaScript is case-sensitive, so make sure all function names and variables are correctly spelled.
Print Statements: Use print statements to debug and understand the flow of the script. This will help you identify where the issue might be occurring.
Error Handling: Add error handling to catch any unexpected issues that might be causing the script to fail.
Simplify the Script: Start with a simpler version of the script to ensure that the basic functionality works before adding more complexity.
Simplified Script for Debugging
Let's start with a simplified version of the script to ensure that the basic functionality works. This script will plot points on the canvas based on the positions of V26 and V27 servos.
Key Points
Error Handling: The
try...catchblock will catch any errors that occur during the execution of the script and print the error message. This will help you identify what might be causing the issue.Print Statements: The print statements will help you understand the flow of the script and the values of the variables at each step.
Simplified Logic: The script focuses on the basic functionality of plotting points based on servo positions. Once this works, you can add more complexity as needed.
Running the Script
Start ARC: Open ARC and load your project.
Add the Script: Add the script to the Script skill in your project.
Run the Script: Run the script and observe the output in the console. Look for any error messages or unexpected behavior.
Debug: Use the print statements and error messages to identify and fix any issues.
By following these steps, you should be able to identify and resolve the issue with the script. If you encounter any specific errors or need further assistance, please provide the details, and I'll be happy to help.
Ah finally, don't know what was done differently but it worked.
This is definitely going to come in handy!! Thanks for your help! I think it may have been something to do with my computer as it had a pop up ask me to make changes to my hard drive and I said no. I then copied and pasted the new script and it's all good.I will keep an eye on debugging and spend some time seeing how it all works, it is very important. Thanks
Expanding on Sketchpad discussion about some of the available scripts for circles controlCommand("Sketch Pad", "CanvasClear"); controlCommand("Sketch Pad", "CanvasClear", "[Color]"); controlCommand("Sketch Pad", "CanvasClear", [Red], [Green], [Blue]); controlCommand("Sketch Pad", "CanvasDrawCircle", [Thickness], [X1], [Y1], [X2], [Y2], "[Color]"); controlCommand("Sketch Pad", "CanvasDrawCircle", [Thickness], [X1], [Y1], [X2], [Y2], [Alpha], [Red], [Green], [Blue]); controlCommand("Sketch Pad", "CanvasDrawCircle", [Thickness], [X1], [Y1], [X2], [Y2], [Red], [Green], [Blue]); controlCommand("Sketch Pad", "CanvasDrawCircleFill", [X], [Y], [Width], [Height], "[Color]"); controlCommand("Sketch Pad", "CanvasDrawCircleFill", [X], [Y], [Width], [Height], [Alpha], [Red], [Green], [Blue]); controlCommand("Sketch Pad", "CanvasDrawCircleFill", [X], [Y], [Width], [Height], [Red], [Green], [Blue]); ...... etc. Is there other items like elipses parabala and other interesting designs. If possible I'd like to see the equation which was used in the script to design these. Recently I had to drill 6 evenly spaced holes in a circular pattern with a diameter of 70 mm. It came out great and very precise, but with plotting there are negative numbers and I'd like to see how they handle these.
No equation. Builtin shapes of windows api.