Tutorial
Published
— Updated
Step 4 of 20
Step 3
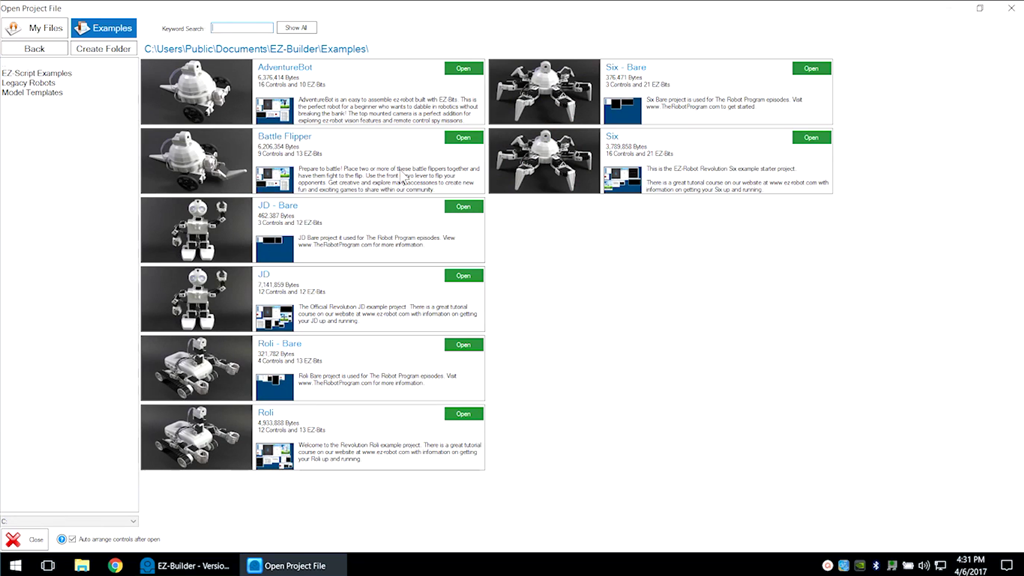
Open the bare project for the desired robot.
 Movement Joystick
— Analog joystick UI to control any ARC movement panel via mouse/touch-configurable dead zone, max speed, center-reset for smooth robot motion
Try it →
Movement Joystick
— Analog joystick UI to control any ARC movement panel via mouse/touch-configurable dead zone, max speed, center-reset for smooth robot motion
Try it →