
can ez-bulider andriod be used with ez-b v3 as it is used via bluetooth not wifi

karan413
India
Asked
— Edited
1 Participant
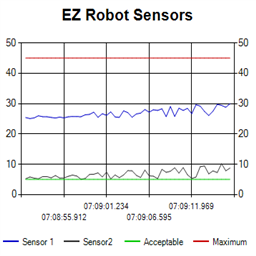 Ez Line Chart
— 4-series historical line chart to log and compare robot sensor values over time with customizable titles, colors, time axis and EZ-Script control
Try it →
can ez-bulider andriod be used with ez-b v3 as it is used via bluetooth not wifi
Yes