tonycarl60
USA
Asked
— Edited
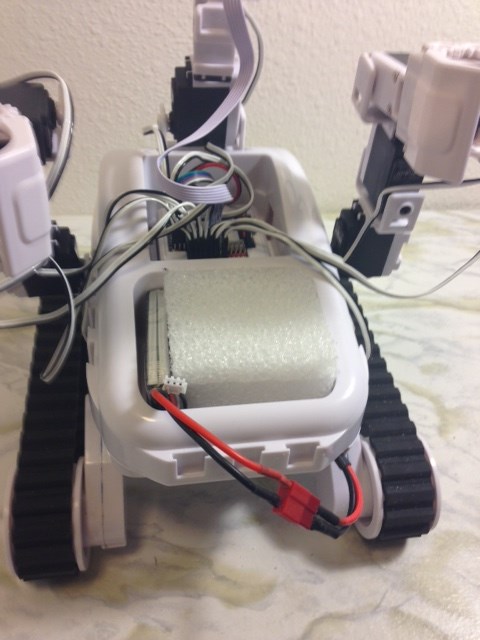
I moved the battery on my Roli to the cargo box on top for easier access. now I can switch out the battery or even run parallel batteries for longer run time.